Wiko Jerry3 vs Nokia C2
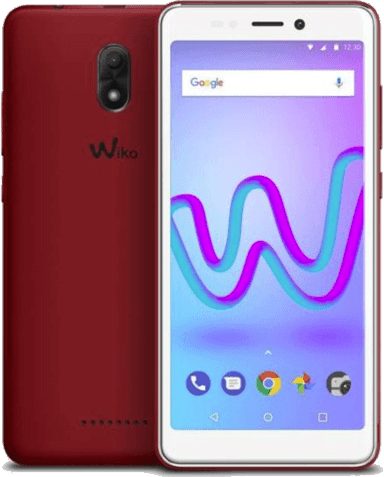
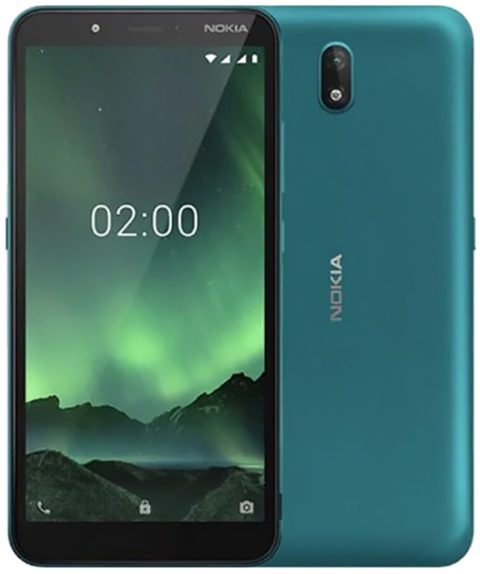
Verdict
Nokia C2 and Wiko Jerry3 are evenly matched for most people
Overall score
2 Wiko Jerry3 4 Nokia C2
Why pick Wiko Jerry3
- 1080p 30fps video recording (vs 720p 30fps)
Why pick Nokia C2
- 0 h 50 min longer battery life Estimated
- 10% cheaper
- Sharper screen (282 ppi vs 197 ppi)
Nokia C2 and Wiko Jerry3 are evenly matched for gaming
Overall score
2 Wiko Jerry3 4 Nokia C2
Why pick Wiko Jerry3
No clear advantage here
Why pick Nokia C2
- Sharper screen (282 ppi vs 197 ppi)
- 0 h 50 min longer battery life Estimated
- 10% cheaper
Nokia C2 and Wiko Jerry3 are evenly matched for photos and video
Overall score
3 Wiko Jerry3 4 Nokia C2
Why pick Wiko Jerry3
- 1080p 30fps video recording (vs 720p 30fps)
Why pick Nokia C2
- Sharper screen (282 ppi vs 197 ppi)
- 10% cheaper
- 0 h 50 min longer battery life Estimated
Nokia C2 and Wiko Jerry3 are evenly matched for battery life
Overall score
2 Wiko Jerry3 4 Nokia C2
Why pick Wiko Jerry3
- 1080p 30fps video recording (vs 720p 30fps)
Why pick Nokia C2
- 0 h 50 min longer battery life Estimated
- 10% cheaper
- Sharper screen (282 ppi vs 197 ppi)
Wiko Jerry3 launched more than three years ago, so it has no value-for-money score
Overall score
— Wiko Jerry3 — Nokia C2
Why pick Wiko Jerry3
- 1080p 30fps video recording (vs 720p 30fps)
Why pick Nokia C2
- 10% cheaper
- 0 h 50 min longer battery life Estimated
- Sharper screen (282 ppi vs 197 ppi)
Wiko Jerry3 launched in 2018 and Nokia C2 in 2020, so the older phone may get fewer software updates.
Scores by category
- Wiko Jerry3
- Nokia C2
Performance
1 Wiko Jerry3 1 Nokia C2Estimated
Display
3 Wiko Jerry3 10 Nokia C2Camera
3 Wiko Jerry3 2 Nokia C2Battery
2 Wiko Jerry3 3 Nokia C2Estimated
Build and durability
4 Wiko Jerry3 9 Nokia C2Connectivity and features
1 Wiko Jerry3 1 Nokia C2
Biggest differences
See all specs Spec Wiko Jerry3Nokia C2 Ahead by
Battery life (active use) 6 h 58 minEstimatedBetter: 7 h 48 minEstimated +0 h 50 min
Pixel density 197 ppiBetter: 282 ppi +43%
Best video mode Better: 1080p 30fps720p 30fps
Size and weight
- Wiko Jerry3
- Nokia C2
Full specs
General
Specs Wiko Jerry3Nokia C2
Announced
Monday, 26 February 2018
Sunday, 22 March 2020
Released
Monday, 26 February 2018
Sunday, 22 March 2020
Status
Discontinued
Discontinued
Design
Specs Wiko Jerry3Nokia C2
Height
148 mm (5.83 inch)
154.8 mm (6.09 inch)
Width
72 mm (2.83 inch)
75.6 mm (2.98 inch)
Thickness
9.1 mm (0.36 inch)
8.9 mm (0.35 inch)
Weight
172 g (6.07 oz)
161 g (5.68 oz)
Build materials
—
Back: Plastic
Frame: Plastic
Front: Glass
Frame: Plastic
Front: Glass
Colors
Black, Blue, Gold, Red
Black, Cyan
Display
Specs Wiko Jerry3Nokia C2
Display type
IPS LCD
IPS LCD
Display size
5.45 inch
5.7 inch
Resolution
480 × 960 pixels
720 × 1440 pixels
Aspect ratio
18:9
18:9
Pixel density
197 ppi
Better:
282 ppi
Screen-to-body ratio
≈ 71.9%
≈ 71.6%
Touchscreen
Yes
Yes
Bezel-less display
Yes
Yes
Display features
Capacitive Touchscreen
Multi-touch display
Multi-touch display
Capacitive Touchscreen
Multi-touch display
Multi-touch display
Hardware
Specs Wiko Jerry3Nokia C2
Chipset
MediaTek MT6580
Unisoc SC9863A
CPU cores
4
8
CPU technology
28 nm
28 nm
CPU max speed
1.3 GHz
1.6 GHz
CPU architecture
32-bit
64-bit
Microarchitecture
Cortex-A7
Cortex-A55
Memory type
LPDDR3
LPDDR4X
GPU
ARM Mali-400 MP2
IMG PowerVR GE8322
RAM
1GB
1GB
Storage
16GB
16GB
Storage type
eMMC 5.1
eMMC 5.1
Variants
16GB 1GB RAM
16GB 1GB RAM
Expandable storage
Yes
Yes
Card slots
microSDXC
microSDXC
Software
Specs Wiko Jerry3Nokia C2
Operating system
Android 8.0 (Oreo)
Android 9.0 (Pie)
Main camera
Specs Wiko Jerry3Nokia C2
Camera support
Yes
Yes
Single camera
5 MP
5 MP, ƒ/2.2
Auto Flash
Flash support
Yes
Yes
Flash type
LED flash
LED flash
Features
High Dynamic Range (HDR)
Auto Flash
Digital Zoom
High Dynamic Range (HDR)
Digital Zoom
High Dynamic Range (HDR)
Video support
Yes
Yes
Video resolution
1080p @ 30 fps
720p @ 30 fps
Front camera
Specs Wiko Jerry3Nokia C2
Camera support
Yes
Yes
Single camera
5 MP
5 MP
Flash support
—
Yes
Flash type
—
LED flash
Video support
—
Yes
Video resolution
—
720p @ 30 fps
Battery
Specs Wiko Jerry3Nokia C2
Type
Li-Poly
Li-Ion
Capacity
2500 mAh
2800 mAh
Removability
—
Removable
Network
Specs Wiko Jerry3Nokia C2
SIM cards
Single SIM (Micro-SIM)
Single SIM (Nano-SIM)
Dual SIM (Nano-SIM + Nano-SIM)
Dual SIM (Nano-SIM + Nano-SIM)
VoLTE support
—
Yes
Data speed
HSPA 21.1/5.76 Mbps
LTE Cat4 150/50 Mbps, HSPA 42.2/5.76 Mbps
Connectivity
Specs Wiko Jerry3Nokia C2
Wi-Fi support
Yes ( Wi-Fi 4 )
Yes ( Wi-Fi 4 )
Wi-Fi standards
802.11/b/g/n
802.11/b/g/n
Wi-Fi features
Mobile Hotspot
Mobile Hotspot
Bluetooth
Yes, v4.0
Yes, v4.2
USB ports
Micro-USB 2.0
Micro-USB 2.0
USB connectivity
USB charging, USB Mass Storage device (UMS)
USB charging, USB Mass Storage device (UMS)
GPS support
Yes
Yes
GPS features
GPS
GPS
NFC support
No
No
Multimedia
Specs Wiko Jerry3Nokia C2
Loudspeaker
Yes
Yes
Headphone jack
Yes
Yes
FM radio
Yes
Yes
Features
Specs Wiko Jerry3Nokia C2
Sensors
Accelerometer
Compass / Magnetometer
Proximity sensor
Compass / Magnetometer
Proximity sensor
Accelerometer
Proximity sensor
Proximity sensor
These phones share every spec listed here.
Compare with other phones


How scores work
Each category score shows where a phone stands among phones launched in the last two years: 80 means it beats 80% of them. Scores move as new phones arrive.
Benchmarks, battery and brightness come from lab tests when the phone was tested. Otherwise the scores use results typical for its chipset, or an estimate from its specifications, and say so.
The camera score rates the hardware (sensor size, lens brightness, stabilization, zoom and video), not the photos themselves.
Small differences people would not notice, such as 120 Hz against 144 Hz, never count as a win. Size and weight are shown but never scored, because bigger is a preference.
Value compares a phone's overall score with what phones at the same price usually score. Phones launched more than three years ago get no value score, because their listed prices are usually used or clearance prices.